

Walk-through popular UML diagrams for system design
This is a summary of types of design diagram that I often use in software engineering


Intro
In the domain of software development, diagrams serve as a tool to visualize and organize the complex architecture, ensure that all stakeholders understand the system’s structure and functionality.
Design diagrams offer a comprehensive overview of both the static and dynamic aspects of the system. They are also indispensable in all stages of software development lifecycle.
In this article, we will explore different types of UML diagram.
1. What is UML?
UML stands for Unified Modeling Language. It defines a standard set of diagram types and symbols you can use to describe just about any aspect of an enterprise architecture ( in this context, I refer to software architecture).
UML has 2 types: static and dynamic. Static diagrams describe the state of the system, like a snapshot and dynamic ones describe the system in motion.
2. Static diagrams
Static design refers to the system’s organization, components and their relationship at compile time.
Some of the most popular static diagrams are:
a. Component
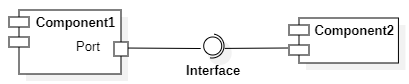
A component diagram describes the various components that make up of the software, their dependency and the interfaces they expose and consume.
Key elements of diagram:
Component: a modular part of the system that includes a set of related functionalities
Interface: component that provides interface uses a lollipop shape symbol. Component that require interface use a half-cycle shape.
Component can be wired together to form a joint ball connection
Port: is an explicit window to an encapsulated component. All interactions are passed through ports. Ports have identity. Each port provides or requires one or multiple interfaces.
b. Class diagram
class diagram refers to the classes, attributes, methods and their relationships.
This is one of the most popular diagram. We should understand the relationship between classes, especially in OOP
Association

Association means any connection between 2 classes. In this case, a home controller contains a sensor.
notation is a solid line connecting 2 classes
Inheritance/Generalization
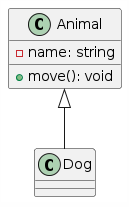
Inheritance means “is a” relationship. In this context, Dog is an animal
Notation is a line with hollow arrow pointing to super class.
Realization/Implementation
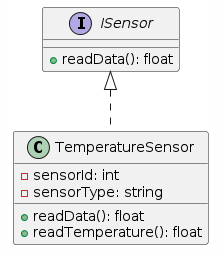
Realization shows child classes implement parent classes’ functionality. In this diagram, TemperatureSensor implements the readData function from the ISensor interface.
notation is a dash line with triangle arrow pointing to parent class.
Aggregation
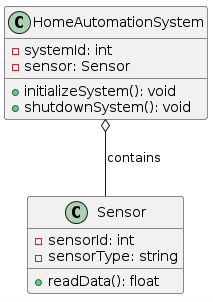

Aggregation is a special type of association. In this case, HomeAutomationSystem takes Sensor reference, not owns it. When HomeAutomationSystem dies, sensor object lives on.
Notation is a line with hollow diamond shape sticking to parent class.
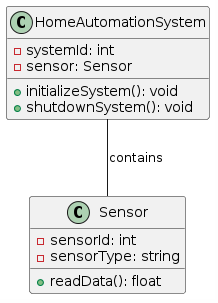
Composition
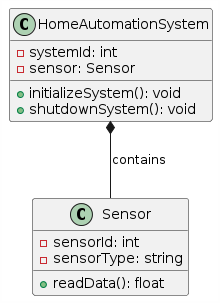
Composition is a special type of association. Not like aggregation, HomeAutomationSystem is responsible for Sensor. When it dies, so does Sensor.
Notation is a black diamond sticking to the parent class.
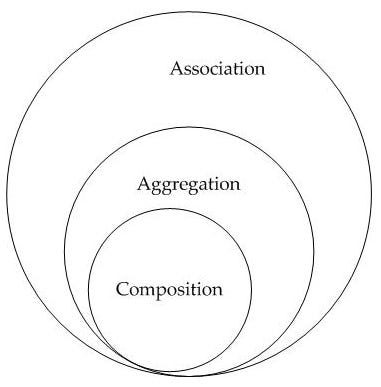
Sum up
Dependency
Dependency is a little bit different from association. It shows a weak relationship between 2 classes
For example
Association: Book class has an object of class Author
class Book {
      Author Name;
};
Dependency: Book class has Author as a parameter
class Book {
public:
      void getBook(Author Name);
};
c. Object diagram
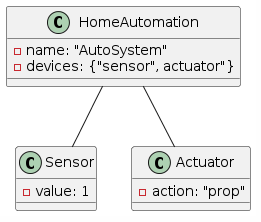
Object diagram is a snapshot of instances in a system and the relationship between them. This diagram is helpful in 2 cases:
After creating class diagrams, object diagrams help you see as testcases to verify the output
Before creating class diagrams, object diagrams help you cover all the cases so that you can come up with a better design.
d. Package diagram
A package can contain multiple design elements, including other packages, to create hierarchies.
A package defines namespace for its content, which it uses for various purposes.
There may be difference in using component and package diagrams. They are context-dependent. component is more about a group of classes with defined interfaces or a replacement for a part of the system. package can be a group of anything and can decompose itself into system diagrams.
e. Profile diagram
To do
f. Deploy diagram
To do
g. Composite structure diagram
To do
3. Dynamic diagrams
Dynamic design deals with the system in terms of run time. It focuses on how components interact, the flow of data, and the execution of events.
a. Use case diagram
Use case diagrams demonstrate different ways users can interact with a system. The user can be a human or other components of the system.
This is ideal for
Show system boundaries
Illustrate user behavior and context
Capture functional requirements
Relationship types in use case diagram
Association: a general link between use cases.
Include: one use case is essential to another use case’s execution. We can use it to break down long use cases in to sub-use cases
Extend: use when an optional behavior is based on conditions
Generalization: a use case inherits behavior from others
Dependency: a use case depends directly on others
b. State diagram
State diagrams describe the system in finite states. Each state represents a behavior or condition of a system or an object of a system. Each state is defined by a set of attributes or properties at a given time.
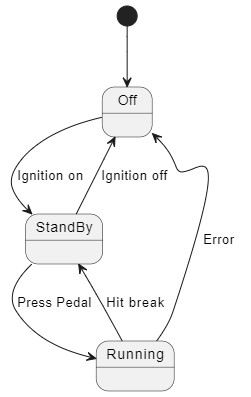
Each diagram has an initial and final state. Each state has a trigger event. If not, we can not escape that state. State can also have sub states inside.
d. Activity diagram
Activity diagrams describe activities at different abstract levels to provide functionalities. It focus on the step-by-step of actions that are needed for functionalities
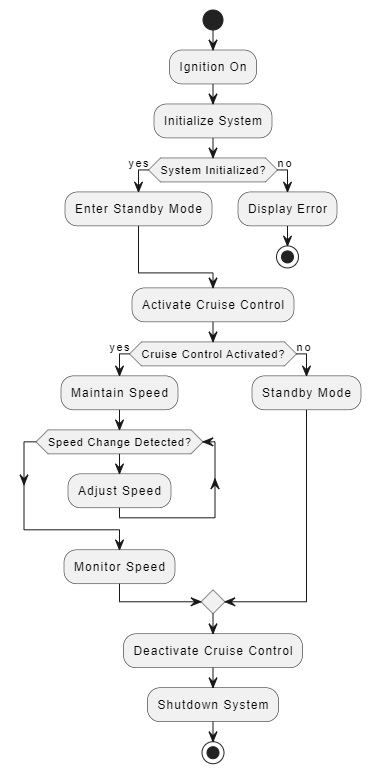
Geeksforgeeks has a very detailed post about activity diagram symbols
e. Sequence diagram
Sequence diagrams show the interactions between objects of the system and how they collaborate in a particular scenario.
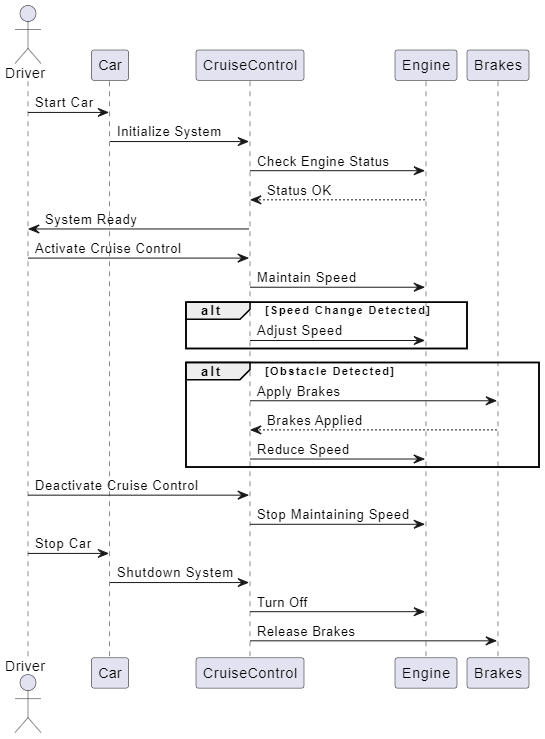
While activity diagrams focus on what actions need to be taken, sequence diagrams focus on the message exchanged and time order of actions.
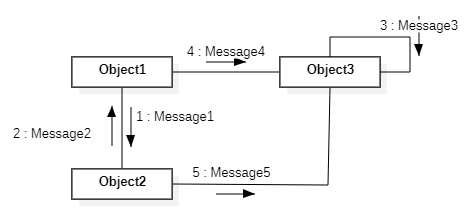
f. Communication diagram
Communication diagrams show the structural relationship and flow between components. Not like sequence diagram, communication diagrams focus on how objects are connected and interact but not show the time order of events.
g. Timing diagram
Timing diagrams focus on how objects interact over time on a linear time axis. It emphasize the time of occurrence of events causing changes along the lifeline.
Final thoughts
There are a lot more diagrams to learn. This article will be updated soon.
Each diagram has its own context. One single diagram type can fit into multiple design documents, and vice versa. The most important thing is to draw it the right way and fill in all necessary content.
if you like my ideas, hit button 💙
If you have any feedback, make sure to 💬 comment.
If you find this helpful, let’s 🔁 share it.